Do you need this or any other assignment done for you from scratch?
We have qualified writers to help you.
We assure you a quality paper that is 100% free from plagiarism and AI.
You can choose either format of your choice ( Apa, Mla, Havard, Chicago, or any other)
NB: We do not resell your papers. Upon ordering, we do an original paper exclusively for you.
NB: All your data is kept safe from the public.
MAT 135 Project One
Population and selection of response and explanatory variables
Description of relationships
The body mass index has a strong positive relationship with systolic blood pressure among individuals. Obesity is a significant risk factor for hypertension because fat deposits restrict the blood flow in arteries and increase blood pressure. Moreover, obesity changes the metabolic mechanism of blood sugar regulation, absorption of ions by kidneys, and hormonal levels, resulting in increased blood pressure among obese individuals. The body mass index is an appropriate parameter for measuring weight because it considers the height of individuals. In this case, the study hypothesizes that an increase in body mass index causes a significant increase in systolic blood pressure.
Collected data
Descriptive Statistics
Table 1 offers a summary of descriptive statistics of body mass index and systolic blood pressure. The body mass index of individuals has a mean of 34.8, mode of 35.0, and median of 35.0. As the measures of spread, the body mass index has a range of 10 with a maximum value of 40 and minimum one of 30, a standard deviation of 2.6, and variance of 6.9. Systolic blood pressure has a mean of 135.5, median of 135.0, and mode of 132. The range of systolic blood pressure is 21 with a maximum value of 145 and minimum one of 124 with a standard deviation of 5.0 and variance of 24.7.
Table 1: Descriptive Statistics of Body Mass Index and Systolic Blood Pressure
Graphs
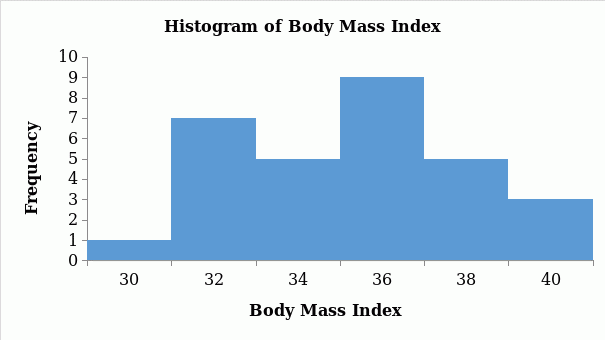
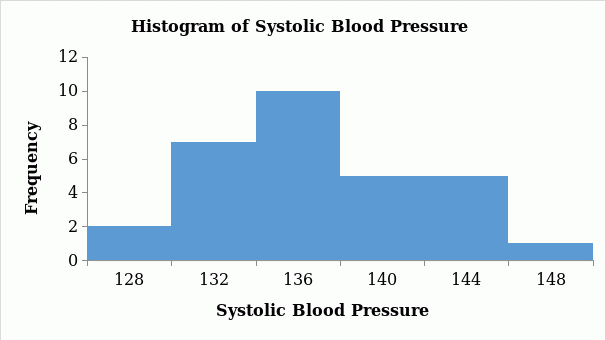
Histograms of body mass index (Figure 1) and systolic blood pressure (Figure 2) show that their data follow the normal distribution. In body mass index, most individuals were between 34 and 36, while in systolic blood pressure, the group of 134-136 had the highest frequencies.


Linear regression
Scatterplot of my data
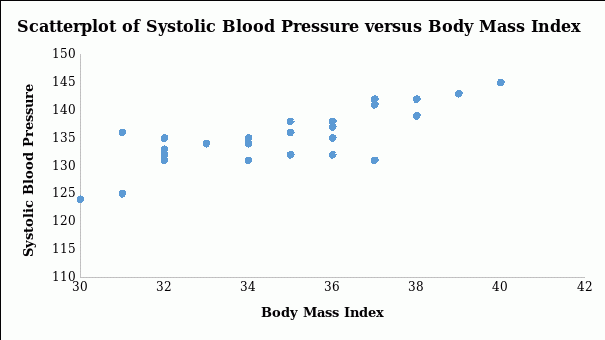
The scatterplot (Figure 3) shows that the systolic blood pressures have a linear relationship with body mass index because of the consistent trend of data points. Additionally, the linear relationship is a positive one since the systolic blood pressure increases with the rise in the body mass index.

Correlation
Correlation outcomes (Table 2) show that the body mass index and systolic blood pressure have a strong positive relationship (r = 0.803). The correction coefficient implies that systolic blood pressure rises as the body mass index increases among individuals. Since body mass index is an explanatory variable, it has a positive influence on systolic blood pressure among individuals. Linderman et al. (2018) aver that body mass index is a causal factor of hypertension among individuals. Therefore, the strong relationship confirms that body mass index in people with obesity contributes to high blood pressure.
Table 2: Correlation between body mass index and systolic blood pressure
The linear regression equation for my data.
Regression coefficients (Table 3) indicate that a unit increase in the body mass index causes the systolic blood pressure to increase by 1.52 units. Hence, the following is the linear regression equation:
-
Systolic blood pressure = 82.51 + 1.52 (systolic blood pressure)
Table 3: Regression Output
The meaning of the y-intercept from part c means in terms of your two variables.
The y-intercept in the regression equation means that the systolic blood pressure would be 82.51 when the body mass index is zero.
The meaning of slope
The slope of the regression equation shows is a positive relationship where a unit increase in the body mass index makes the systolic blood pressure to increase by 1.52 units.
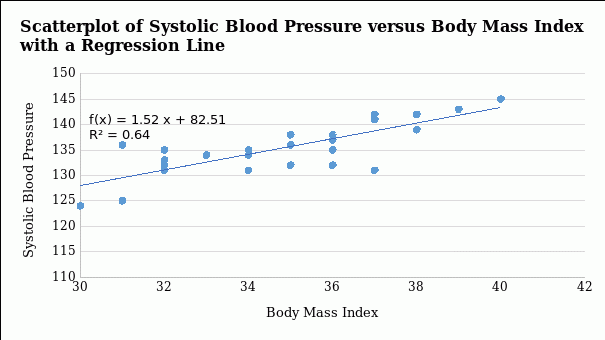
Scatter plot with the regression line (Figure 4):

Two random individuals (Table 4):
Table 4: Residual values of two random variables
Description of results and assumptions
The analysis of the relationship between variables matches the assumption of the study that an increase in body mass index causes a significant increase in systolic blood pressure. The scatterplot shows a trend of data points depicting a positive relationship between the body mass index and the systolic blood pressure. The regression output (Table 2) confirms that the body mass index has a strong relationship with the systolic blood pressure (R = 0.803). It also reveals that the body mass index accounts for 64.5% of the variation in the systolic blood pressure in people with obesity. The regression model used is statistically significant in predicting the impact of body mass index on the systolic blood pressure among people with obesity, F(1,28) = 50.86, p = 0.000. The regression coefficient shows that a unit increase in the body mass index results in an increase of the systolic blood pressure by 1.52 units among people with obesity.
Reference
Linderman, G. C., Lu, J., Lu, Y., Sun, X., Xu, W., Nasir, K.,& & Krumholz, H. M. (2018). Association of body mass index with blood pressure among 1.7 million Chinese adults. JAMA Network Open, 1(4), 1-11.
Do you need this or any other assignment done for you from scratch?
We have qualified writers to help you.
We assure you a quality paper that is 100% free from plagiarism and AI.
You can choose either format of your choice ( Apa, Mla, Havard, Chicago, or any other)
NB: We do not resell your papers. Upon ordering, we do an original paper exclusively for you.
NB: All your data is kept safe from the public.